Learn how to use Autopsy to investigate artifacts from a disk image. Use your knowledge to investigate an employee who is being accused of leaking private company data.
What is Autopsy?
The official description: "Autopsy is the premier open source forensics platform which is fast, easy-to-use, and capable of analyzing all types of mobile devices and digital media. Its plug-in architecture enables extensibility from community-developed or custom-built modules. Autopsy evolves to meet the needs of hundreds of thousands of professionals in law enforcement, national security, litigation support, and corporate investigation."
Autopsy is a powerful tool. Several features within Autopsy were developed thanks to the Department of Homeland Security Science and Technology funding. You can read more about this here.
This room's objective is to provide an overview of how to use the Autopsy tool to perform analysis on disk images and the assumption is that you are familiar with the Windows operating system and Windows artifacts in relation to forensics.
Before proceeding, start the attached virtual machine. If you wish to use RDP, the credentials are below.
RDP credentials:
Username: administrator
Password: letmein123!
Your machine's IP address is 10.10.133.244
Installing Autopsy for Windows is pretty straightforward.
Visit the Autopsy download page and download the Windows MSI, which corresponds to your Windows architecture, 32bit or 64bit.
Run the Autopsy MSI file
If Windows prompts with User Account Control, click Yes
Click through the dialog boxes until you click a button that says Finish
Autopsy is also available for Linux and macOS. Follow the install instructions provided on the Autopsy website.
If you use Kali Linux, Autopsy is already installed.
Before diving into Autopsy and analyzing data, there are a few steps to perform, such as identifying the data source and what Autopsy actions to perform with the data source.
Your basic workflow:
Create the case for the data source you will investigate
Select the data source you wish to analyze
Configure the ingest modules to extract specific artifacts from the data source
Review the artifacts extracted by the ingest modules
Create the report
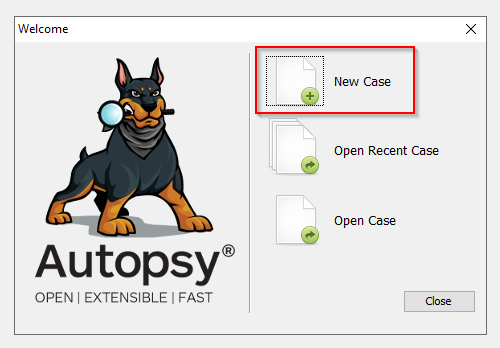
Below is a visual of step #1.
When you start Autopsy, there will be 3 options. To start a new case, click on New Case.
The next screen is titled Case Information, and this is where information about the case is populated.
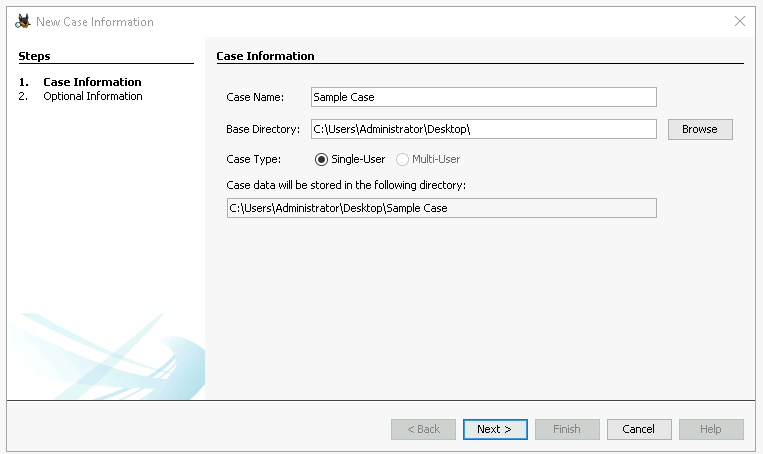

Note: In this room, the focus is on Single-User.
The screen that follows is titled, Optional Information and it can be left blank for our purposes. In an actual forensic environment, you should fill out this information. When you're done, click Finish.
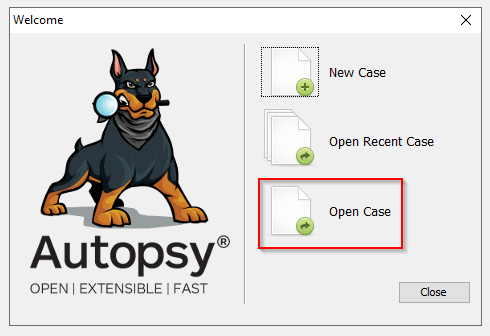
In this room, you will import a case. To open a case, you will select is Open Case.
Autopsy case files have an .aut file extension. Navigate to the case folder and select the .aut file you wish to open.
Next, Autopsy will process the case files open the case.
You can identify the name of the case at the top left corner of the Autopsy window. In the image below, the name of this case is Tryhackme.
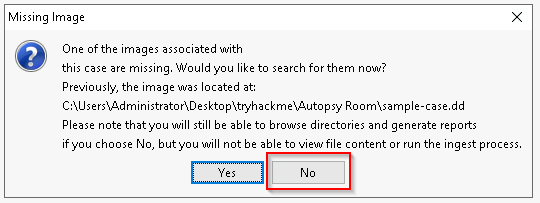
Note: If Autopsy is unable to locate the disk image, a warning box will appear. At this point, you can point Autopsy to the location of the disk image it's attempting to find, or you can click NO; you can still analyze the data from the Autopsy case.
Once the case you wish to analyze is open, you are ready to start analyzing the data.
Autopsy files end with which file extension? .aut
Before diving into analyzing the data, let's briefly cover the different data sources Autopsy can analyze.
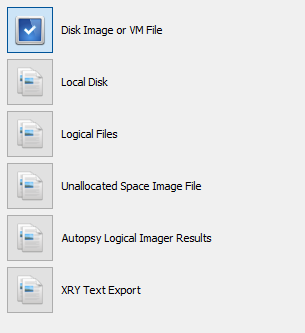
Below is a screenshot of the Add Data Source Windows dialog box.
In this room, we will focus primarily on the first option, Disk Image or VM file.
Supported Disk Image Formats:
Raw Single (For example: *.img, *.dd, *.raw, *.bin)
Raw Split (For example: *.001, *.002, *.aa, *.ab, etc)
EnCase (For example: *.e01, *.e02, etc)
Virtual Machines (For example: *.vmdk, *.vhd)
If there are multiple image files (e.i. E01, E02, E03, etc.) Autopsy only needs you to point to the first image file, and Autopsy will handle the rest.
Note: Refer to the Autopsy documentation to understand the other data sources that can be added to a case.
Below is a screenshot of an E01 disk image added to a sample case as a data source.
Specify the time zone and click Next.
Note: Orphan files are deleted files that no longer have a parent folder. In FAT file systems, it can be time-sensitive to read and analyze.
In the above screenshot, what is the disk image format for SUSPECTHD? EnCase
Essentially Ingest Modules are Autopsy plug-ins. Each Ingest Module is designed to analyze and retrieve specific data from the drive.
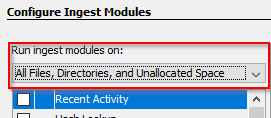
Below is a screenshot of the Configure Ingest Modules window.
By default, the Ingest Modules are configured to run on All Files, Directories, and Unallocated Space.
The other two options are:
All Files and Directories (Not Unallocated Space)
Create/edit file ingest filters...
Note: We will not cover ingest filters in this room.
If all the Ingest Modules are deselected, and Next is selected, Autopsy will still process the data source and update the local database.
Note: Autopsy adds metadata about files to the local database, not the actual file contents.
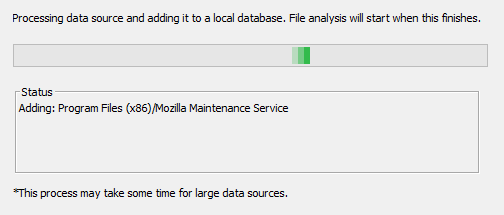
When Autopsy is done, you will see the following:
To complete this process, click Finish.
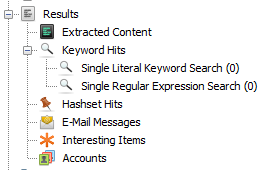
In the below image, since the Ingest Modules were deselected, there aren't any results in the Results node.
The results of any Ingest Module you select to run against a data source will populate the Results node in the Tree view, which is the left pane of the Autopsy user interface.
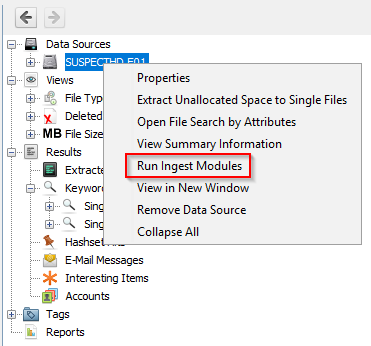
You can run Ingest Modules at any time while the case is open. To do so, right-click on the data source and select Run Ingest Modules.
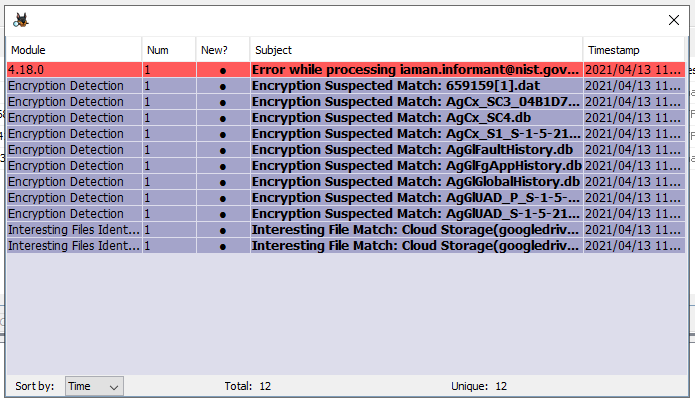
As Ingest Modules run, alerts may appear in the Ingest Inbox.
Below is an example of the Ingest Inbox after a few Ingest Modules have completed running.
Drawing the attention back to the Configure Ingest Modules window, notice that some Ingest Modules have per-run settings and some do not.
For example, the Recent Activity Ingest Module does not have per-run settings. In contrast, the Hash Lookup Ingest Module does.
To learn more about Ingest Modules, read Autopsy documentation here.
Let's look at the Autopsy user interface, which is comprised of 5 primary areas:
Tree Viewer (Left pane)
Result Viewer (Top right pane)
Keyword Search (Upper Top Right)
Contents Viewer (Bottom right pane)
Status Area (Lower Bottom right)
Each area will be explained briefly below.
The Tree Viewer has 5 top-level nodes:
Data Sources - all the data will be organized as you would typically see it in a normal Windows File Explorer.
Views - files will be organized based on file types, MIME types, file size, etc.
Results - as mentioned earlier, this is where the results from Ingest Modules will appear.
Tags - will display files and/or results that have been tagged (read more about tagging here)
Reports - will display reports either generated by modules or the analyst. (read more about reporting here)
Refer to the Autopsy documentation on the Tree Viewer for more information here.
Result Viewer
Note: Don't confuse the Results node (from the Tree Viewer) with the Result Viewer.
When a volume, file, folder, etc., are selected from the Tree Viewer, additional information about the selected item is displayed in the Result Viewer.
For example, the Sample case's data source is selected, and now additional information is visible in the Results Viewer.
If a volume is selected, the Result Viewer's information will change to reflect the information in the local database for the selected volume.
Notice that the Result Viewer pane has 3 tabs: Table, Thumbnail, and Summary. The 2 above screenshots reflect the information displayed in the Table tab.
The Thumbnail tab works best with image or video files. If the view of the above data is changed from Table to Thumbnail, not much information will be displayed. See below.
Volume nodes can be expanded, and an analyst can navigate the volume's contents, as they would a typical Windows system.
In the Views tree node, files are categorized by File Types - By Extension, By MIME Type, Deleted Files, and By File Size.
Tip: When it comes to File Types, pay attention to this section. An adversary can rename a file with a misleading file extension. So the file will be 'miscategorized' By Extension but will be categorized appropriately by MIME Type.
Expand By Extension and more children nodes appear, categorizing files even further (see below).
Refer to the Autopsy documentation on the Result Viewer for more information here.
Contents Viewer
From the Table tab in the Result Viewer, if you click any folder/file, additional information is displayed in the Contents Viewer pane.
In the above image, 3 columns might not be quickly understood what they represent.
S = Score
The Score will show a red exclamation point for a folder/file marked/tagged as notable and a yellow triangle pointing downward for a folder/file that is marked/tagged as suspicious. These items can be marked/tagged by an Ingest Module or by the analyst.
C = Comment
If a yellow page is visible in the Comment column, it will indicate that there is a comment for the folder/file.
O = Occurrence
In a nutshell, this column will indicate how many times this file/folder has been seen in past cases (this will require the Central Repository)
Refer to the Autopsy documentation on the Contents Viewer for more information here.
Keyword Search
At the top right, you will find Keyword Lists and Keyword Search.
With Keyword Search, an analyst can perform an AD-HOC keyword search.
In the image above, the analyst is searching for the word 'secret.' Below are the search results.
Refer to the Autopsy documentation for more information on how to perform keyword searches with either option.
Status Area
Lastly, the Status Area is at the bottom right.
When Ingest Modules are running, a progress bar (along with the percentage completed) will be displayed in this area. If you click on the bar, more detailed information regarding the Ingest Modules is provided.
If the X (directly next to the progress bar) is clicked on, a prompt will appear confirming if you wish to end cancel the Ingest Modules.
Refer to the Autopsy documentation on the UI overview here.
┌──(kali㉿kali)-[~]
└─$ xfreerdp /u:'administrator' /p:'letmein123!' /v:10.10.184.12 /size:85%
Expand the "Data Sources" option; what is the number of available sources? 4
![[Pasted image 20221126201123.png]]
What is the number of the detected "Removed" files? Removed files can be found under the "Recycle Bin" category. 10
![[Pasted image 20221126201250.png]]
What is the filename found under the "Interesting Files" section? googledrivesync.exe
The User Interface II
Let's look at where we can find summarised info with ease. Summarised info can help analysts decide where to focus by evaluating available artefacts. It is suggested to view the summary of the data sources before starting an investigation. Therefore you can have a general idea about the system and artefacts.
Data Sources Summary
The Data Sources Summary provides summarised info in nine different categories. Note that this is an overview of the total findings. If you want to dive deep into the findings and look for a specific artefact, you need to analyse each module separately using the "Result Viewer" shown in the previous task.
Generate Report
You can create a report of your findings in multiple formats, enabling you to create data sheets for your investigation case. The report provides all information listed under the "Result Viewer" pane. Reports can help you to re-investigate findings after finishing the live investigation. However, reports don't have additional search options, so you must manually find artefacts for the event of interest.
Tip: The Autopsy tool can be heavy for systems with low resources. Therefore completing an investigation with Autopsy on low resources can be slow and painful. Especially browsing long results might end up with a system freeze. You can avoid that situation by using reports. You can use the tool for parsing the data and generating the report, then continue to analyse through the generated report without a need for Autopsy. Note that it is always easier to conduct and manage an investigation with the GUI.
You can use the "Generate Report" option to create reports. The steps are shown below.
Once you choose your report format and scope, Autopsy will generate the report. You can click on the "HTML Report" section (shown above) to view the report on your browser. Reports contain all of the "Result Viewer" pane results on the left side.
![[Pasted image 20221126201924.png]]
What is the full name of the operating system version? Windows 7 Ultimate Service Pack 1
What percentage of the drive are documents? Include the % in your answer. 40.8%
![[Pasted image 20221126202518.png]]
![[Pasted image 20221126202455.png]]
![[Pasted image 20221126202702.png]]
Generate an HTML report as shown in the task and view the "Case Summary" section. What is the job number of the "Interesting Files Identifier" module? 10
Case Scenario: An employee was suspected of leaking company data. A disk image was retrieved from the machine. You were assigned to perform the initial analysis. Further action will be determined based on the initial findings.
Reminder: Since the actual disk image is not in the attached VM, certain Autopsy sections will not display any actual data, only the metadata for that row within the local database. You can click No when you're notified about the 'Missing Image.' Additionally, you do not need to run any ingest modules in this exercise.
![[Pasted image 20220907151638.png]]
What is the full name of the operating system version? *Windows 7 Ultimate Service Pack 1 *
![[Pasted image 20220907151538.png]]
What percentage of the drive are documents? Include the % in your answer. (Look for a tab that will display various information for the drive.) 40.8%
![[Pasted image 20220907151733.png]]
The majority of file events occurred on what date? (MONTH DD, YYYY) March 25,2015
![[Pasted image 20220907151858.png]]
What is the name of an Installed Program with the version number of 6.2.0.2962? eraser
![[Pasted image 20220907152002.png]]
A user has a Password Hint. What is the value? IAMAN
![[Pasted image 20220907152051.png]]
Numerous SECRET files were accessed from a network drive. What was the IP address? 10.11.11.128
![[Pasted image 20220907152246.png]]
What web search term has the most entries? information leakage cases
![[Pasted image 20220907152353.png]]
What was the web search conducted on 3/25/2015 21:46:44? anti-forensic tools
![[Pasted image 20220907152452.png]]
What binary is listed as an Interesting File?
googledrivesync.exe
![[Pasted image 20220907152626.png]]
What self-assuring message did the 'Informant' write for himself on a Sticky Note? (no spaces) Tomorrow...Everything will be OK...
You may have noticed that other parts of the user interface weren't discussed as of yet.
Please refer to the Autopsy documentation for the following visualization tool:
Images/Videos - http://sleuthkit.org/autopsy/docs/user-docs/4.12.0/image_gallery_page.html
Communications - http://sleuthkit.org/autopsy/docs/user-docs/4.12.0/communications_page.html
Timeline - http://sleuthkit.org/autopsy/docs/user-docs/4.12.0/timeline_page.html
Note: Within the attached VM, you will NOT be able to practice with some of the visualization tools, except for Timeline.
Below is a screenshot of the Timeline.
The Timeline tool is composed of 3 areas:
Filters - narrow the events displayed based on the filter criteria
Events - the events are displayed here based on the View Mode
Files/Contents - additional information on the event(s) is displayed in this area
There are 3 view modes:
Counts -  the number of events is displayed in a bar chart view
Details - information on events is displayed, but they are clustered and collapsed, so the UI is not overloaded
List - the events are displayed in a table view
In the above screenshot, the View Mode is Counts. Below is a screenshot of the Details View Mode.
The numbers (seen above) indicate the number of clustered/collapsed events for a specific time frame.
For example, for /Windows, there are 130,257 events between 2009-06-10 and 2010-03-18. See the below image.
To expand a cluster, click on the green icon with the plus sign. See the below example.
To collapse the events, click on the red icon with a minus sign.
Click the map marker icon with a plus sign if you wish to pin a group of events. This will move (pin) the events to an isolated section of the Events view.
To unpin the events, click on the map marker with the minus sign.
The last group of icons to cover are the eye icons. If you wish to hide a group of events from the Events view, click on the eye with a minus sign.
In the below screenshot, the clustered events for /Boot were hidden and were placed in Hidden Descriptions (in the Filters area).
If you wish to reverse that action and unhide the events, right-click and select Unhide and remove from list. See the below example.
Last but not least, below is a screenshot of the List View Mode.
This should be enough information to get you started interacting with the Timeline with some level of confidence.
![[Pasted image 20220907153322.png]]
Using the Timeline, how many results were there on 2015-01-12? 46
To conclude, there is more to Autopsy that wasn't covered in detail within this room.
Below are some topics that you should explore on your own to configure Autopsy to do more out of the box:
Global Hash Lookup Settings
Global File Extension Mismatch Identification Settings
Global Keyword Search Settings
Global Interesting Items Settings
Yara Analyzer
3rd Party modules are available for Autopsy. Visit the official SleuthKit GitHub repo for a list of 3rd party modules here.
The disk image used with this room's development was created and released by the NIST under the Computer Forensic Reference Data Sets (CFReDS) Project. It is encouraged to download the disk image, go through the full exercise (here) to practice using Autopsy, and level up your investigation techniques.
[[Redline]]


